

Column Lineage displays a Data Flow, allowing the user to view the data sources of an object. Column Lineage for SAP Entities is automated. It is also possible to use Column Lineage exclusively from Custom Entities.
Supported SAP Object Types
Column Lineage can be displayed for the following object types:
SAP BW:
-
Calculated Key Figures
-
Restricted Key Figures
-
Local Formulas (in Queries)
-
Local Selections with key Figures (in Queries)
SAP Datasphere:
-
Calculated Measures
If you do not see a tab for the Object Lineage, you might have to add the tab in the corresponding SAP Template.
Navigation in the Data Flow
Compressed View
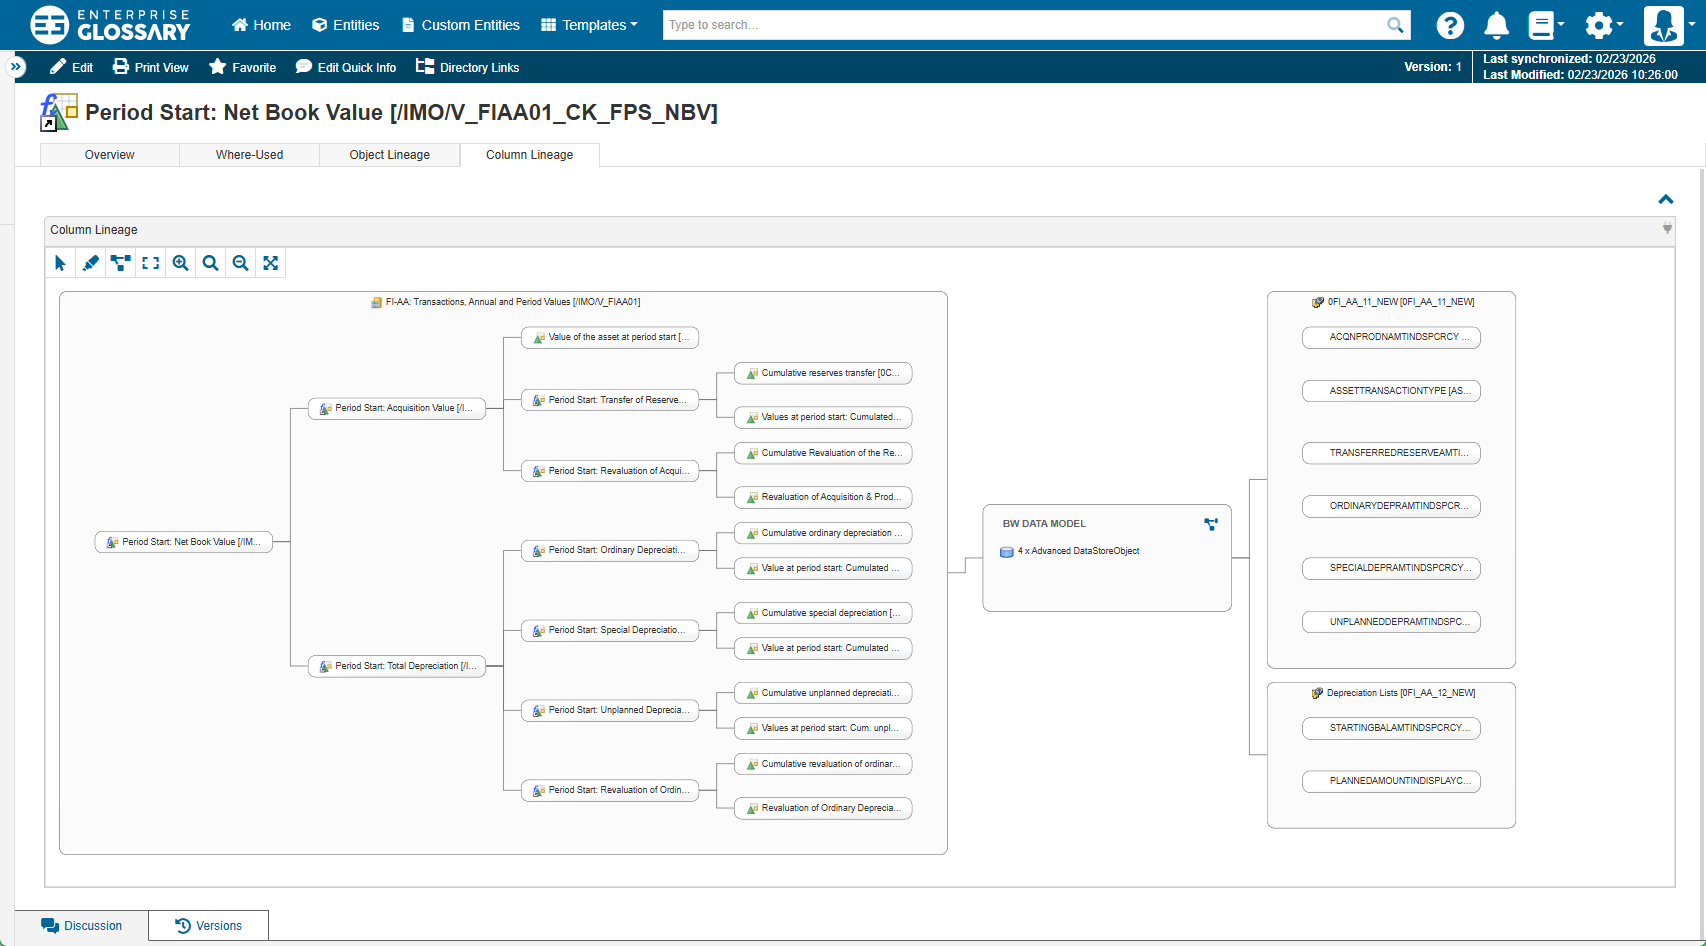
Initially, the Data Flow is displayed in a compressed view where elements between the start and end points are listed in a summary. There are data model nodes for SAP Busniess Warehouse and SAP S/4HANA. Data model nodes summarize the nodes between the starting point and the end point of that data model. This reduces the amount of nodes so that only the starting point and end point are visible.
Expanded View
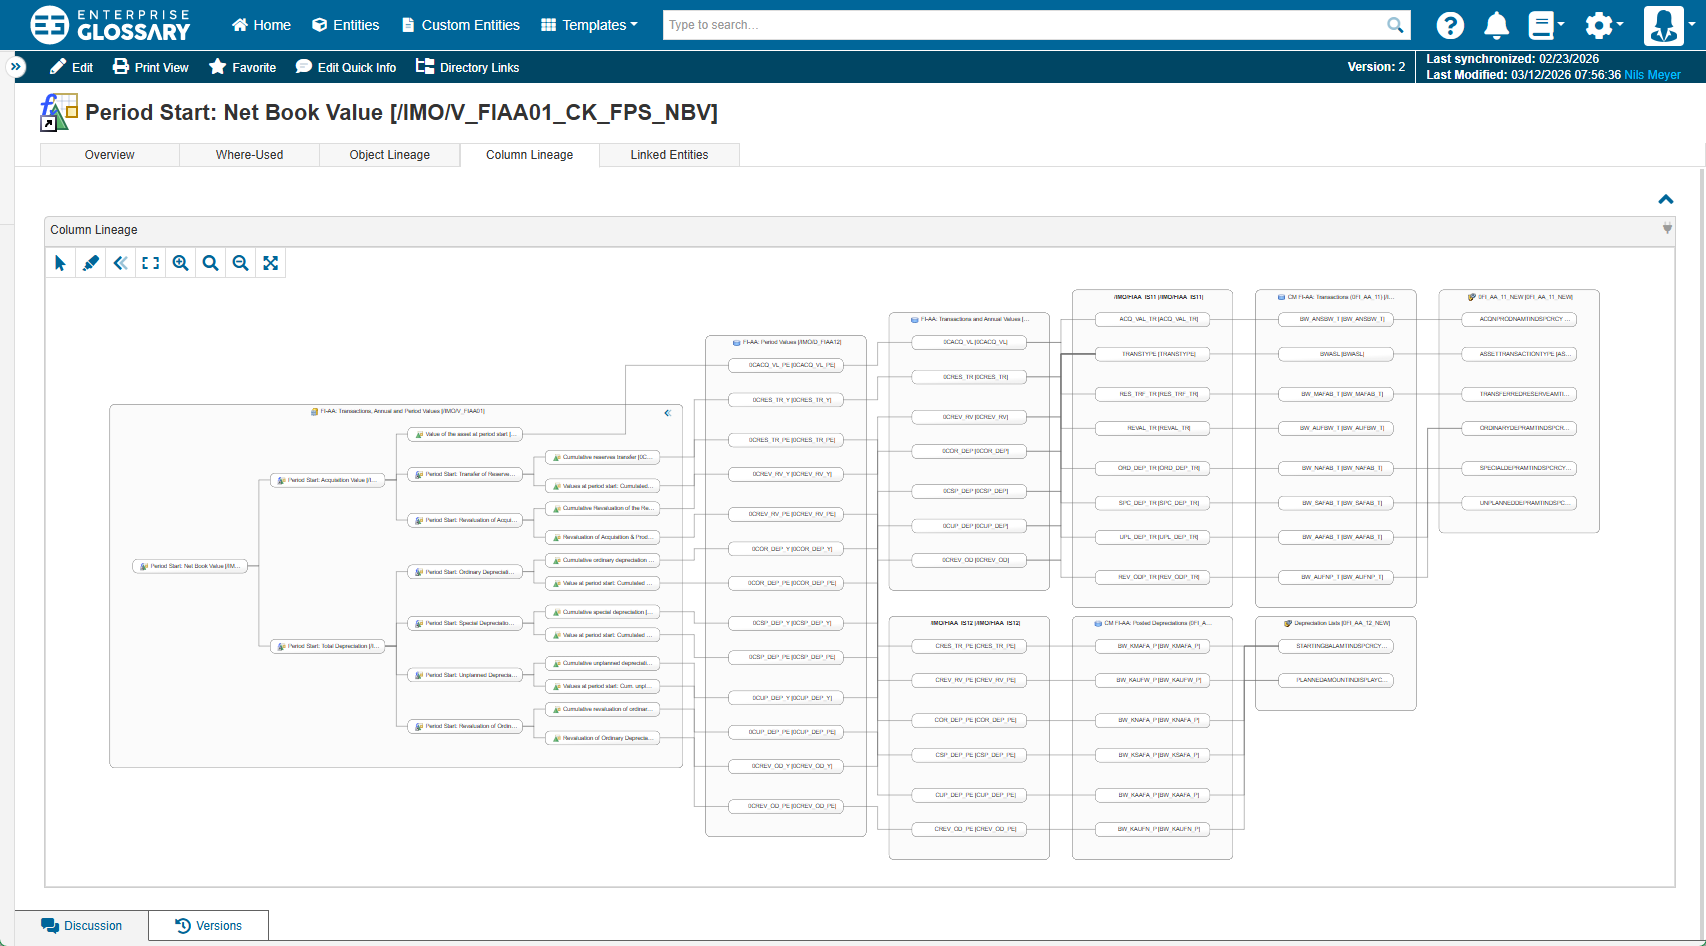
You can expand the view to display all the elements of the Data Flow.
Node Info Panel
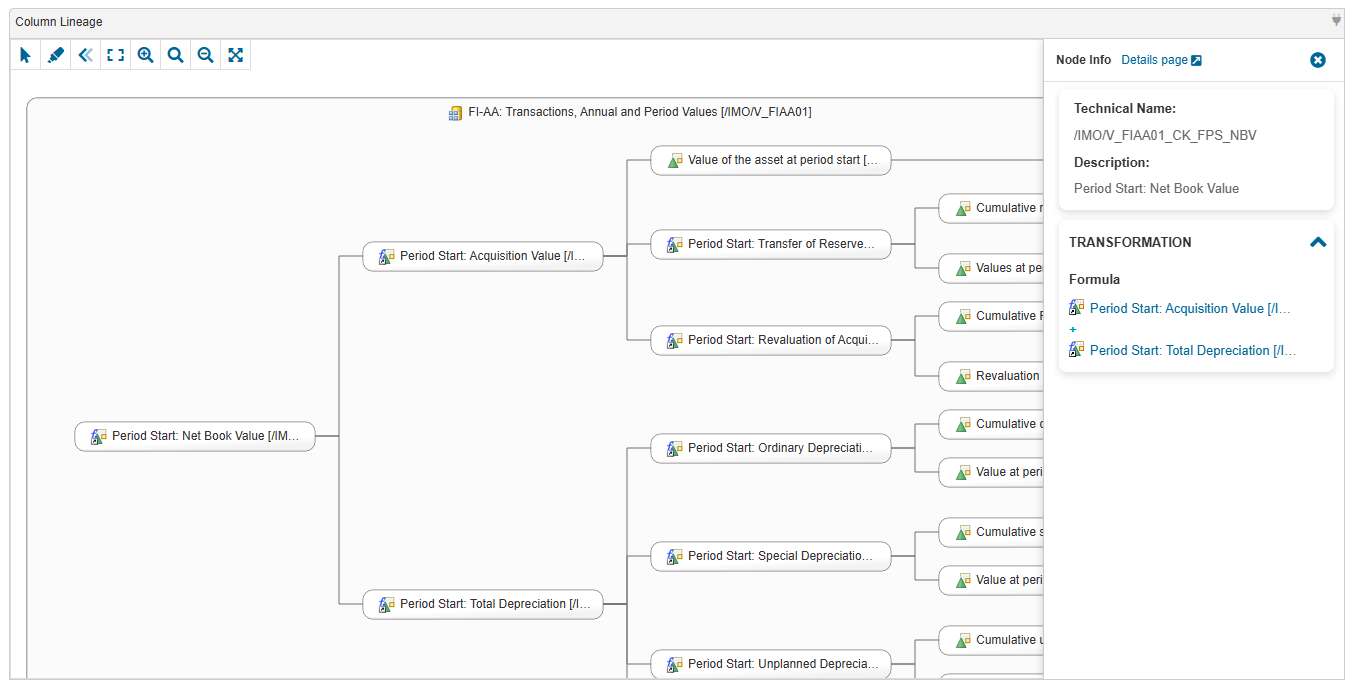
When selecting a node in the Column Lineage, a panel on the right side displays more details about the selected node. These information include:
-
Link to the corresponding Entitys detail page when available
-
Technical Name
-
Description
-
Formula of Calculated Key Figures
-
Definition of Rrstricted Key Figures
Controls

|
Select and move elements in the Data Flow. |

|
Drag along the canvas. |

|
Fit the Data Flow in the available space. |

|
Enter the fullscreen mode. |

|
Exit the fullscreen mode. |

|
Display the expanded view of the Data Flow. |

|
Display the compressed view of the Data Flow. |

|
Return to the default zoom level. |

|
Increase the zoom level. |

|
Decrease the zoom level. |

|
Highlight connections of a selected node. When the connections of a selected node are highlighted, use mouse over to hightlight the connections of a second node and see overlapping connections. |